

Guest Post by Martin Armstrong
There is always a time to buy and a time to sell. The short-term is just noise. If the Dow or Gold rallies for two weeks and then declines, that does not alter the long-term course until we have reached a turning point. But people want to see you as a forecaster daily, which is nonsense. The more someone trades, the lower their performance, and the risks increase exponentially. I have done the long-term because we were the largest institutional adviser. They are not day traders.


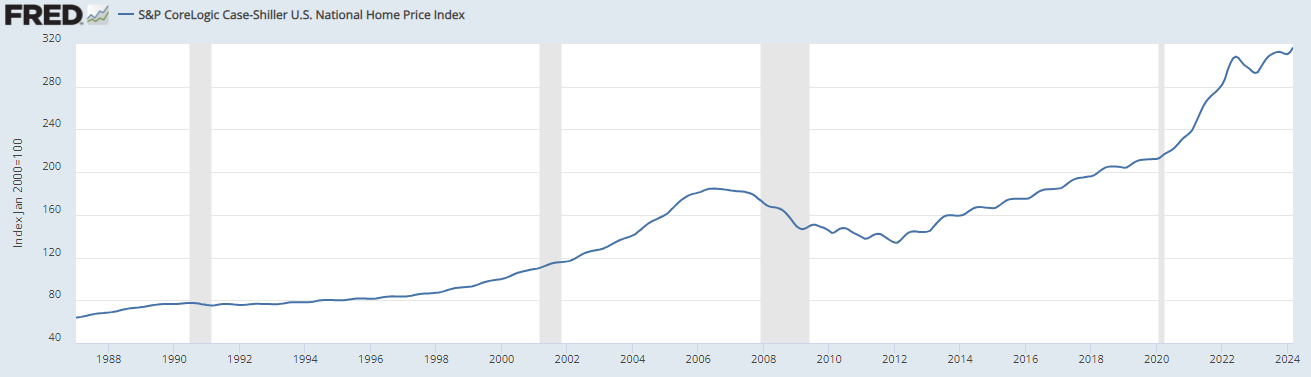
Yes, the 2007 high on the Shiller Index was the precise day of the Economic Confidence Model. So far, all the indicators have confirmed that we should have a recessionary trend into 2028 with this turn in the model on this wave. With the prospect of war on the horizon, people will contract in their spending because of uncertainty.

We have gone through a period of a boom, but with war on the horizon, people will pull back on their spending, and we will generally enter a recession from May 2024 into August 2028. The shift from the Blue to the Red states is still occurring. So, real estate in the blue states will fall in price rapidly. The decline will vary from place to place.

Now we should enter a BUYER’S market whereas from 2020-2024 was a SELLER’S Market.


What?
Home prices are going to continue going down, in general.
If they’re going from blue to red states, then red state aught to see a rise in prices or at least stay flat?
Which states are building the most, red or blue?
Are the interest rates different in red states as opposed to blue. Can you define the relevance?
Suppy vs Demand
It is believed a lot of people are “fleeing” Blue states to move to red states. That means the home market has less demand for blue states because people are leaving them. Whether those are for sell or merely be rented is the question. As these people are moving to red states, there s a greater demand for homes there. Or in math HR (suppy of homes in red states) HB (Supply of homes is red states) P (price of homes ) DR ( Demand for red state homes ) DB ( Demand for blue state homes )
DR > DB, HR < HB
if you hold supply constant you get P increases as Demand goes UP
if you hold demand constant you get P increases as Supply goes DOWN
So from above P in Blue goes down as both Supply
Increases and Demand Drops
and P in Red goes up as both Supply Drops and Demand Increases
interest rates are NOT part of the price picture in this case
Then how do you explain the 35% crash in TN in real estate prices and sales? The flood of commies leaving Cali and moving to TN was driving the market, they are still moving into the south. The minute the rates spiked is WHEN the crash started in TN, so I see people sidelined for lower interest rates, No?
You can’t blame elevated property tax and insurance in TN as you can in Florida. I know that market, it took a big slide.
fl. is exploding —
i have never seen so much growth at any time in my life —
Yet, I have a Realtor friend in Fort Myers who had to take a $20/hr job.
BL,
Rates went up a while ago. Homes are still selling. No, they aren’t selling like the were but they still are. Sales in the DMV are down, I think about 20% so, that means 80% of sales are still there. Yes, I was talking about the demand as Econ 101 said above.
I just heard on the radio that only 6% or renters can afford to buy right now. Damn. I wonder what % of young people 24-36 can afford to buy right now.
Can we say Shit is fucked up and bullshit?